OpenBao Compatibility Check: Running Vault + Nomad Patterns with Minimal Changes
If you already run Nomad + Vault patterns in production, the first question about OpenBao is simple: will our existing workloads still run without a rewrite? In

In the ever-evolving landscape of software development, the need for observability has become paramount. As applications and infrastructure grow more complex, the ability to understand, monitor, and troubleshoot their behavior in real-time is a fundamental requirement. This is where Grafana Cloud and OpenTelemetry, as dynamic tools, enter the scene.
In this blog post, we will explore the powerful synergy between Grafana Cloud and OpenTelemetry. We'll delve into how to send data to Grafana Cloud to use the game-changing potential of OpenTelemetry for monitoring, tracing and logging.
Whether you are an experienced developer looking to improve your observability stack or a newcomer to the world of monitoring, tracing and logging, this blog post is intended to provide you with a starting point and a practical example of using OpenTelemetry data in Grafana Cloud.
Grafana Cloud is a comprehensive observability platform designed to empower organizations to gain deep insights into their applications and infrastructure. Born out of the open-source Grafana project, it extends the capabilities of Grafana to provide a unified, cloud-based solution for monitoring, visualization, and alerting. It offers an forever free plan to getting started on observability.
OpenTelemetry is an open-source project that aims to standardize and simplify the collection of observability data in software applications. It provides a framework and a set of APIs to instrument, collect, and transmit telemetry data, which includes metrics, traces, and logs. OpenTelemetry is a critical component in modern observability and monitoring solutions, allowing developers to gain insights into the behavior and performance of their applications and systems.
In order to see hands on, how we can integrate Grafana Cloud with OpenTelemetry, we can use the already instrumented microservice demo application provided by OpenTelemetry, which will be referred to as OTel-Demo from now on.
Once you have met the prerequisites, we can start by adding the OpenTelemetry Helm repo:
1helm repo add open-telemetry https://open-telemetry.github.io/opentelemetry-helm-charts
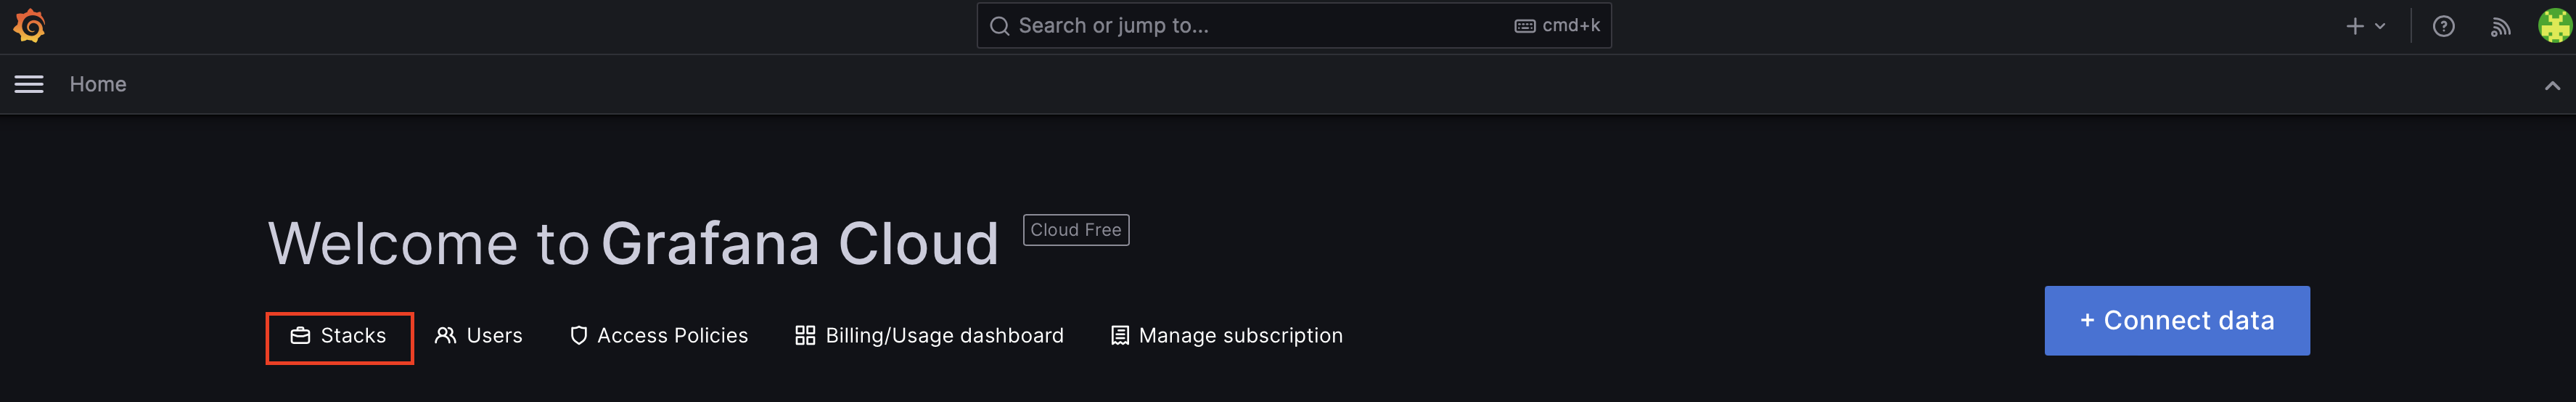
Before we can deploy the Helm chart, we need to get a few things, which can be found in the Grafana Cloud Portal (to access the portal you can click on one of the links at the top of the landing page of Grafana Cloud).
The following URLs and Usernames are found in the Details page of the corresponding Integration:
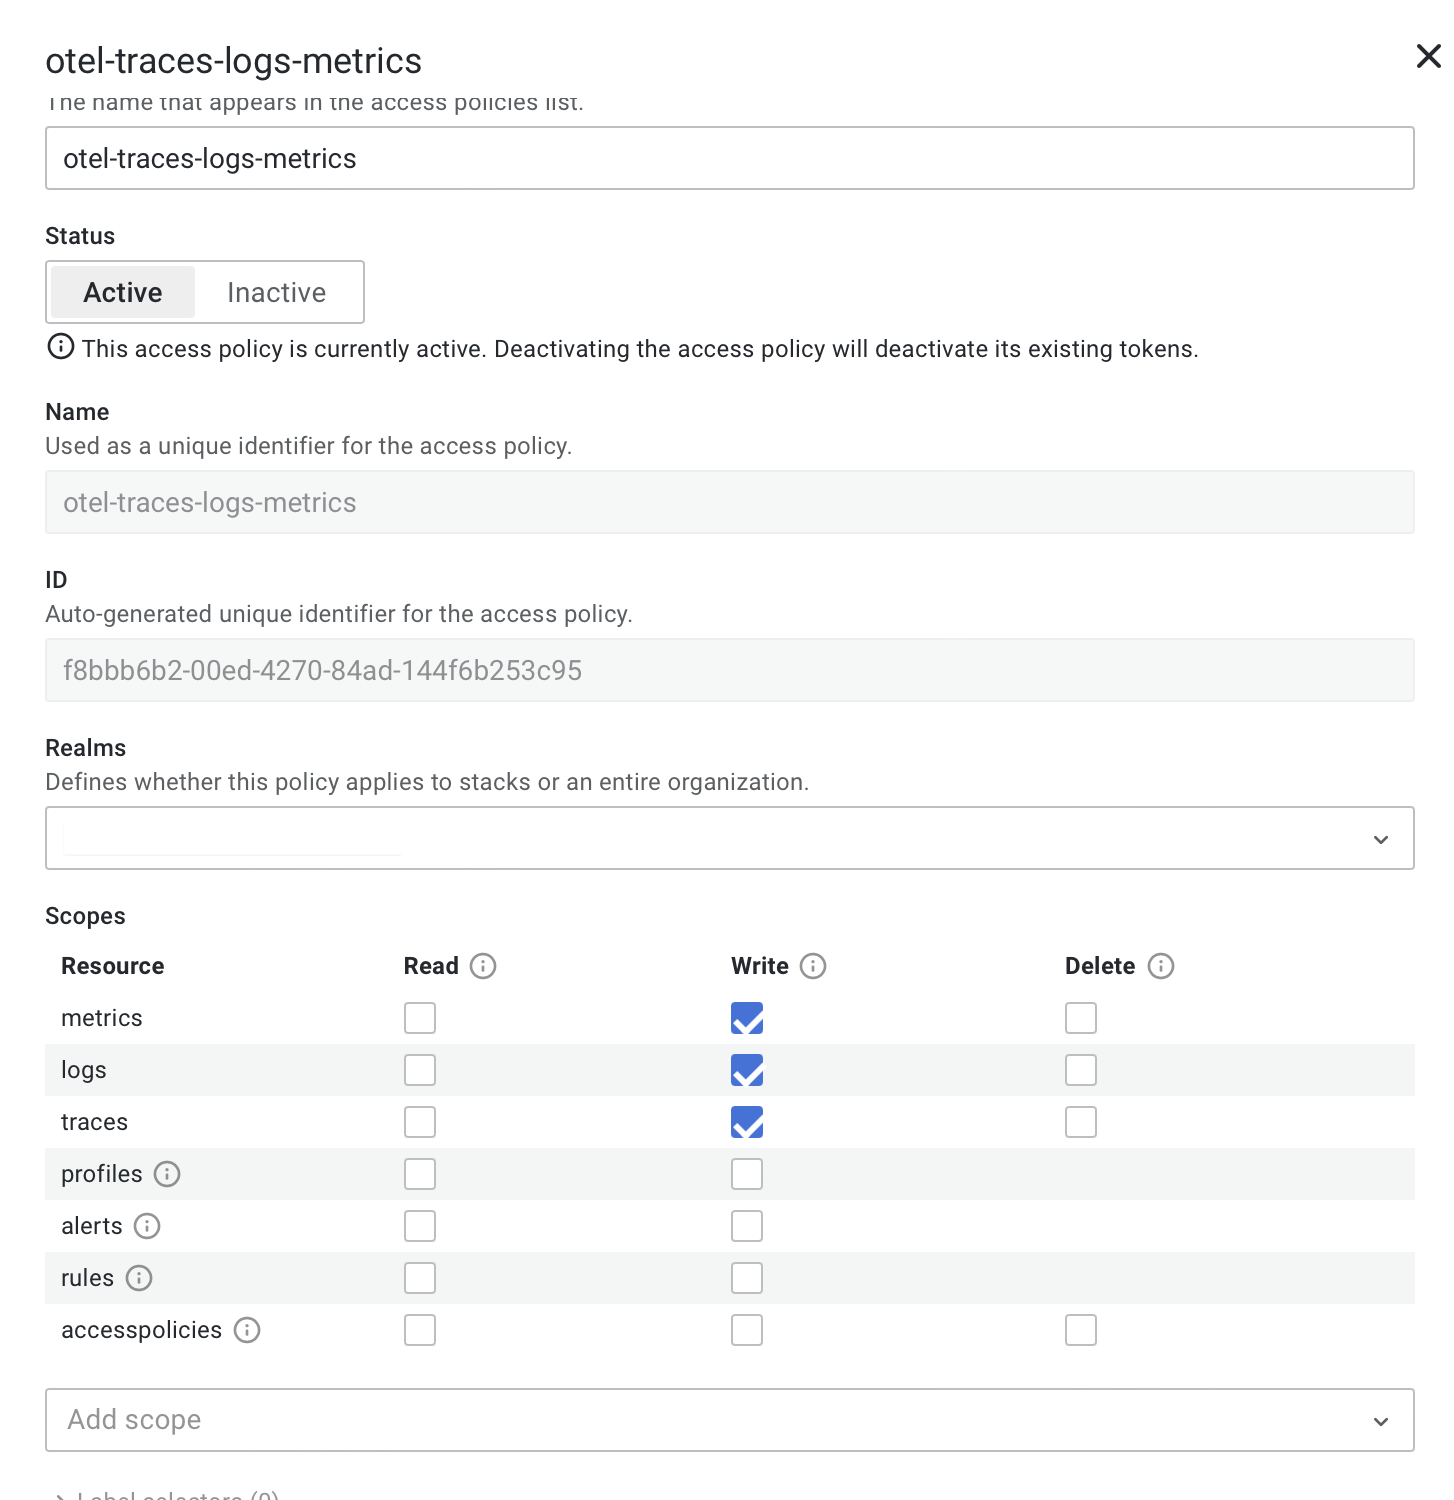
<PROMETHEUS-URL>.<PROMETHEUS-USER-ID> (e.g. 12345).<TEMPO-URL-WITHOUT-HTTPS> by extracting the hostname and port (e.g. tempo-us-central1.grafana.net:443).<TEMPO-USER-ID>.<LOKI-URL> and append /loki/api/v1/push (e.g. https://logs-prod-us-central1.grafana.net/loki/api/v1/push).<LOKI-USER-ID>.<ACCESS-POLICY-TOKEN>.With all the URLs, Usernames and the Token in our possession, we can create a custom values.yaml file for our Helm deployment und replace everything within < > with the correct values.
 1default:
 2  envOverrides:
 3  - name: 'OTEL_COLLECTOR_NAME'
 4    value: <KUBERNETES-NODE-NAME> # kubectl get nodes
 5
 6opentelemetry-collector:
 7  mode: daemonset
 8  presets:
 9    logsCollection:
10      enabled: true
11      includeCollectorLogs: false
12  config:
13    extensions:
14      basicauth/traces:
15        client_auth:
16          username: <TEMPO-USER-ID>
17          password: <ACCESS-POLICY-TOKEN>
18      basicauth/metrics:
19        client_auth:
20          username: <PROMETHEUS-USER-ID>
21          password: <ACCESS-POLICY-TOKEN>
22      basicauth/logs:
23        client_auth:
24          username: <LOKI-USER-ID>
25          password: <ACCESS-POLICY-TOKEN>
26
27    exporters:
28      otlp:
29        endpoint: <TEMPO-URL-WITHOUT-HTTPS>
30        tls:
31          insecure: false
32        auth:
33          authenticator: basicauth/traces
34
35      prometheusremotewrite:
36        endpoint: <PROMETHEUS-URL>
37        auth:
38          authenticator: basicauth/metrics
39
40      loki:
41        endpoint: <LOKI-URL>
42        auth:
43          authenticator: basicauth/logs
44
45    processors:
46      spanmetrics:
47        metrics_exporter: prometheusremotewrite
48
49    service:
50      extensions: [ basicauth/traces, basicauth/metrics, basicauth/logs, health_check , memory_ballast ]
51      pipelines:
52        metrics:
53          exporters: [prometheusremotewrite]
54        logs:
55          receivers: [filelog]
56          exporters: [loki]
With everything ready, lets deploy our Helm chart:
1helm upgrade --install my-otel-demo open-telemetry/opentelemetry-demo --values values.yaml
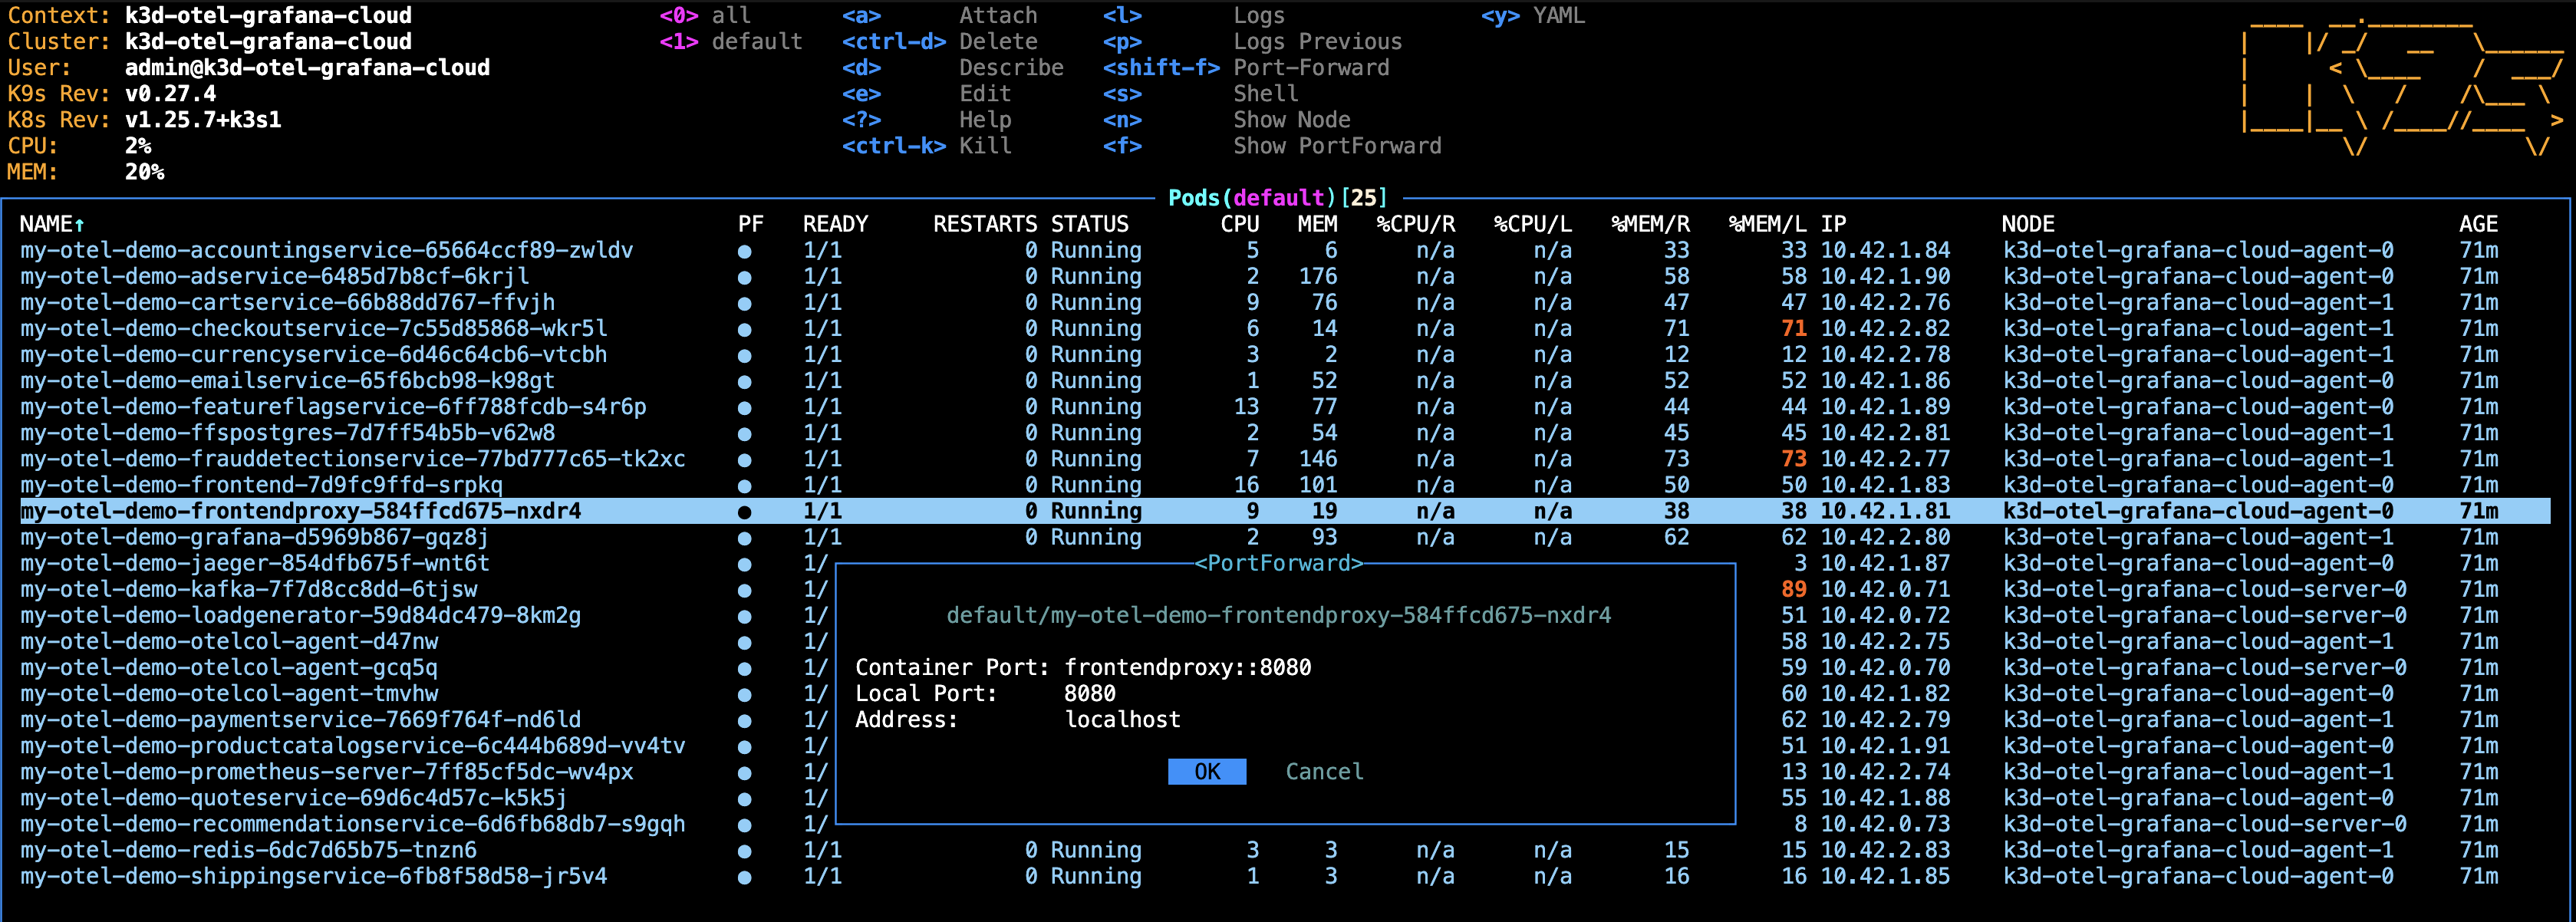
Now we will be able to use the Explorer tap in Grafana Cloud to view our logs, traces and metrics, as well as expose the frontend of the demo application, we just deployed:
port-forward:1kubectl port-forward svc/my-otel-demo-frontendproxy 8080:8080
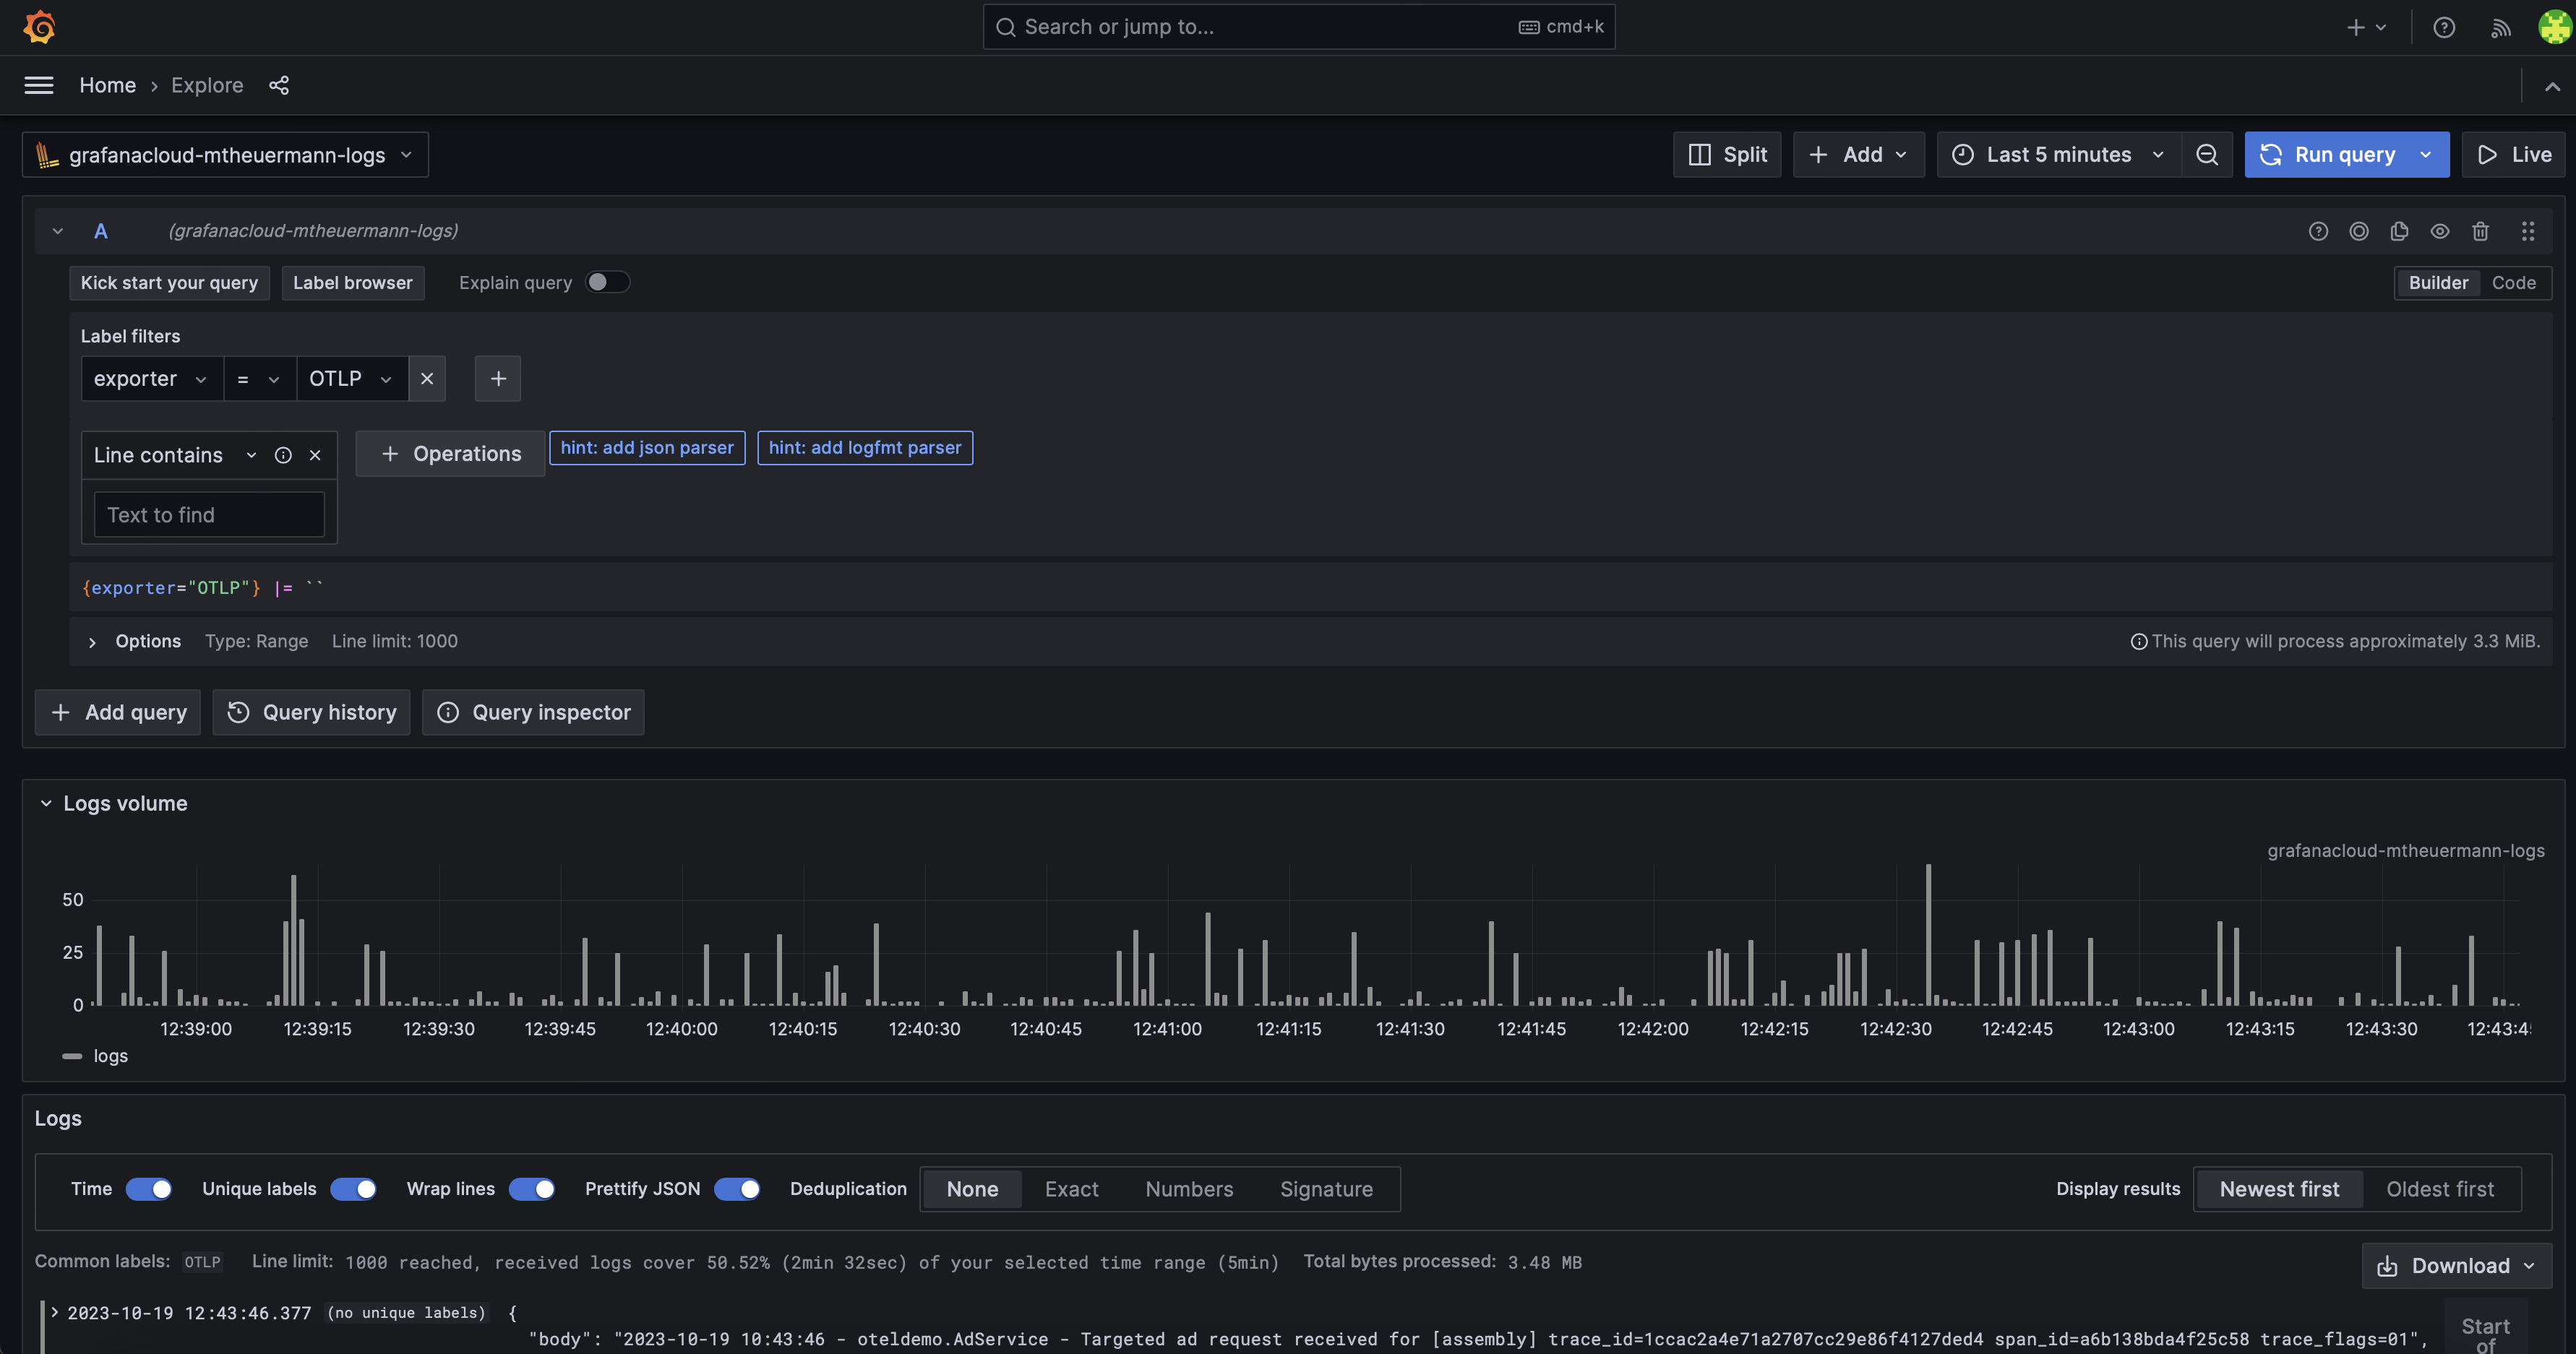
On the Explorer tap switch to the Loki data source and explore the logs:
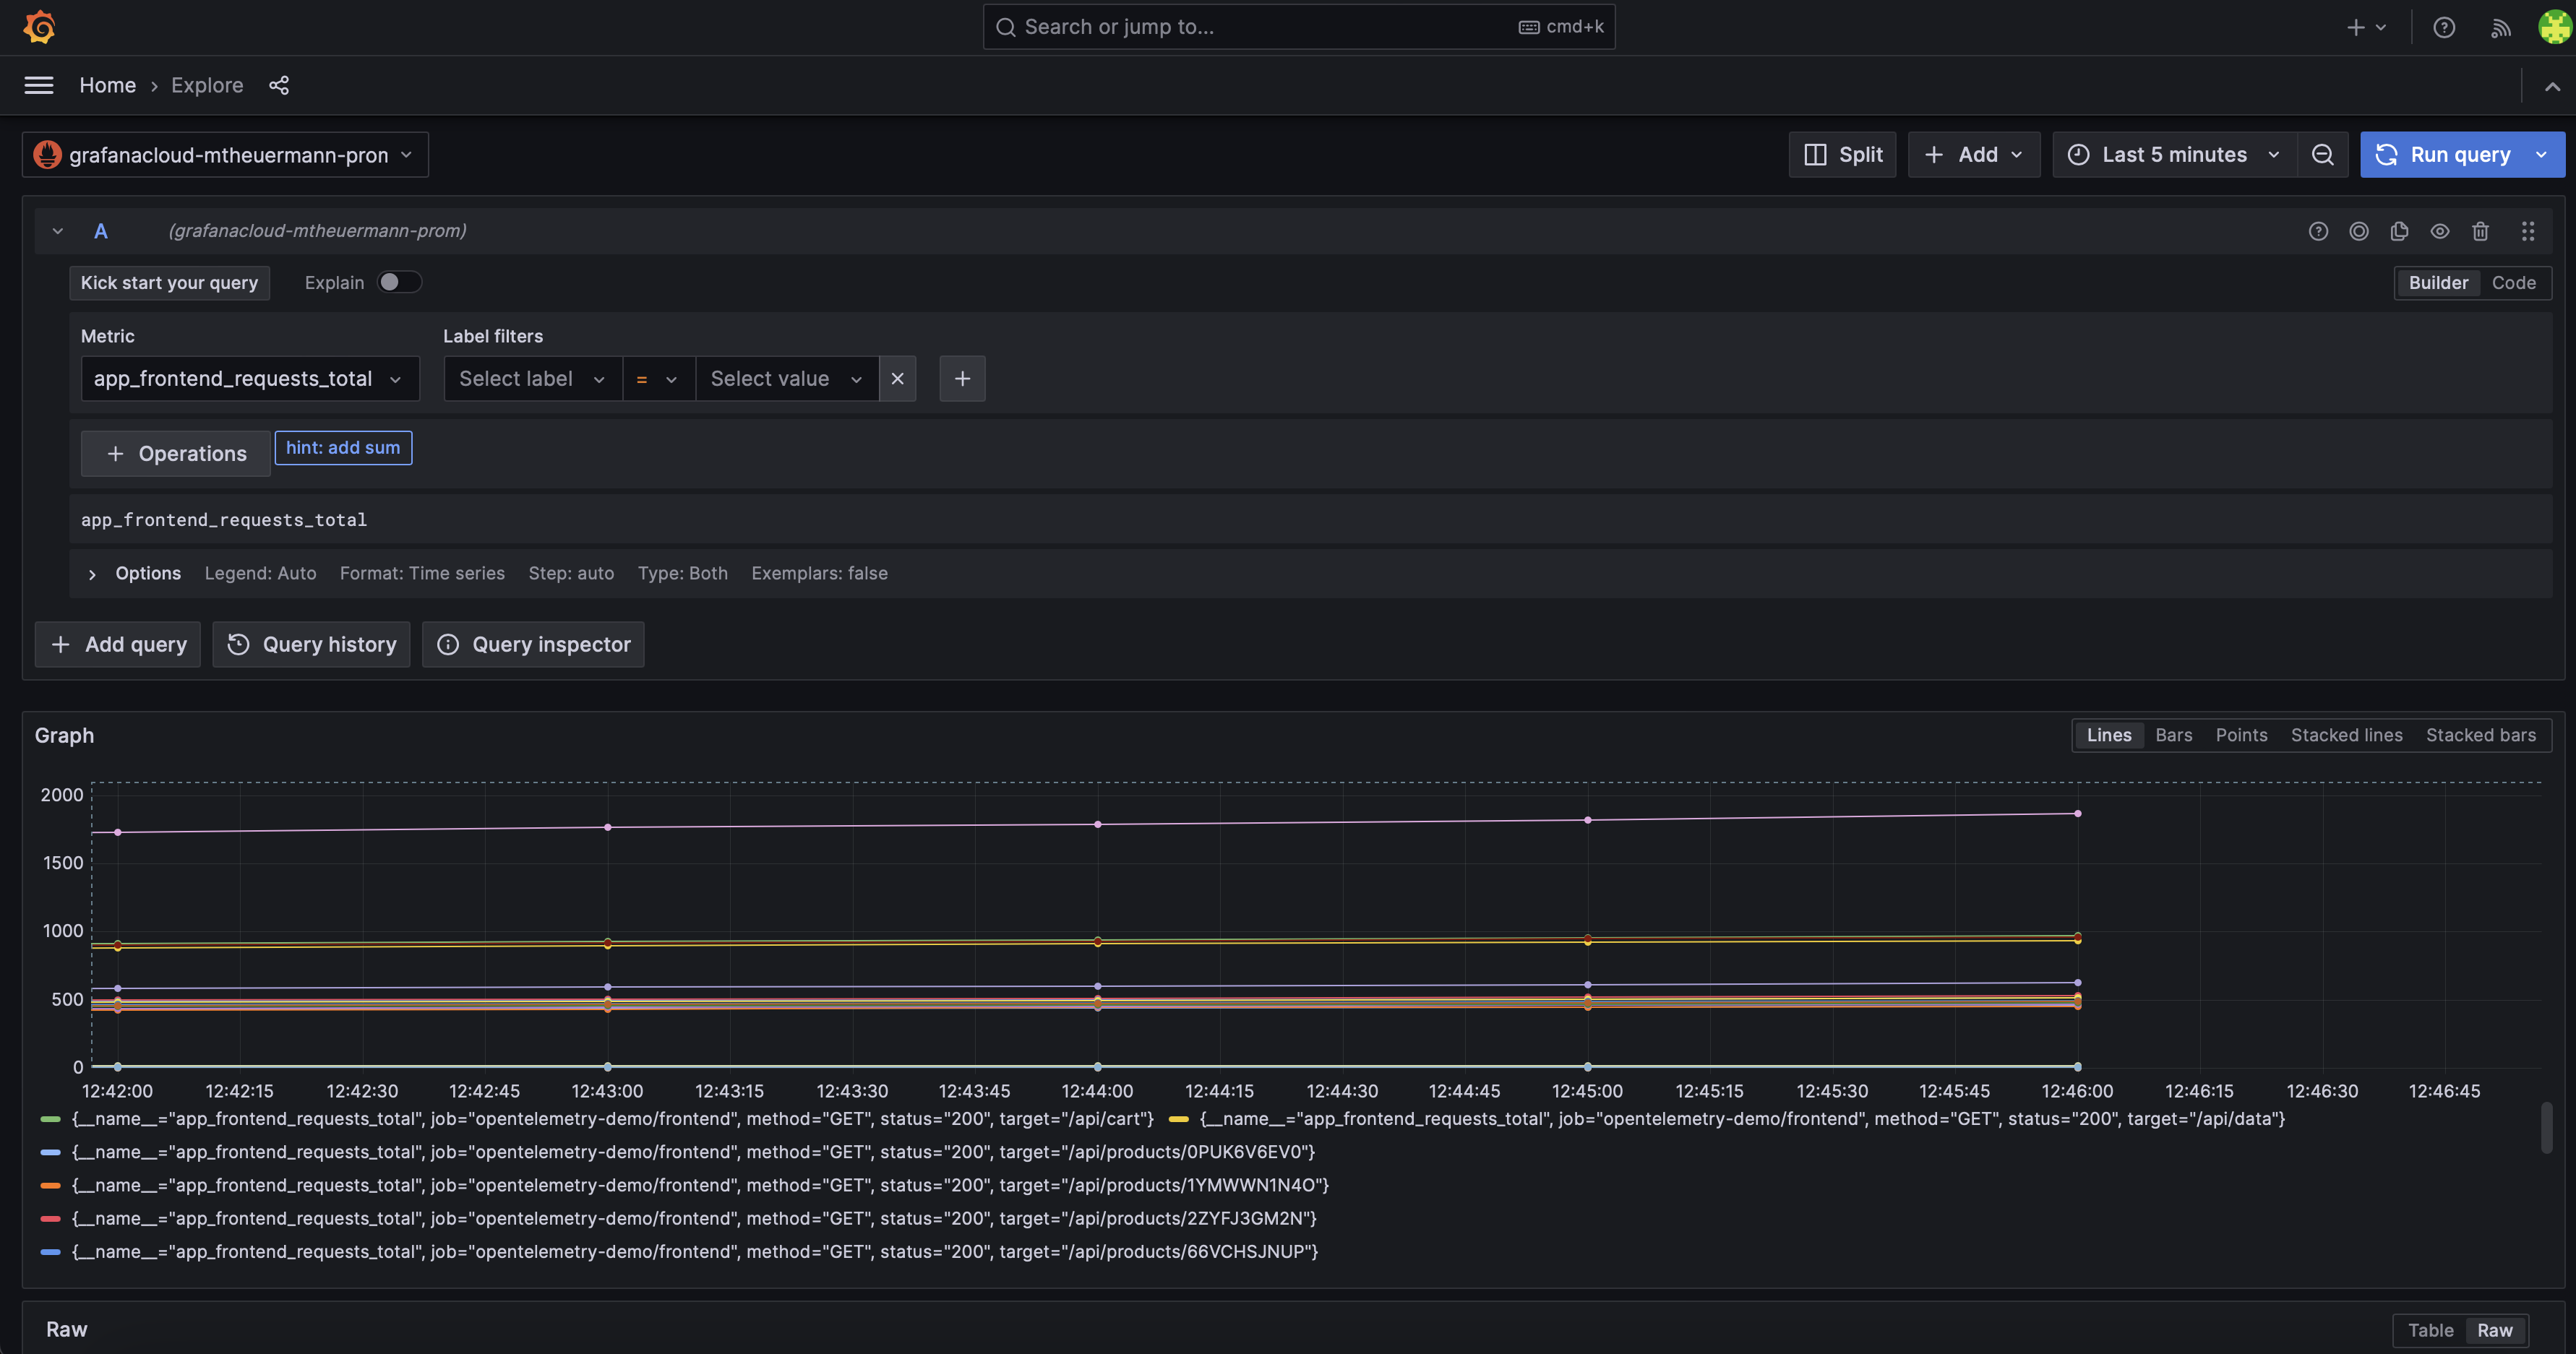
On the Explorer tap switch to the Prometheus data source and explore the metrics:
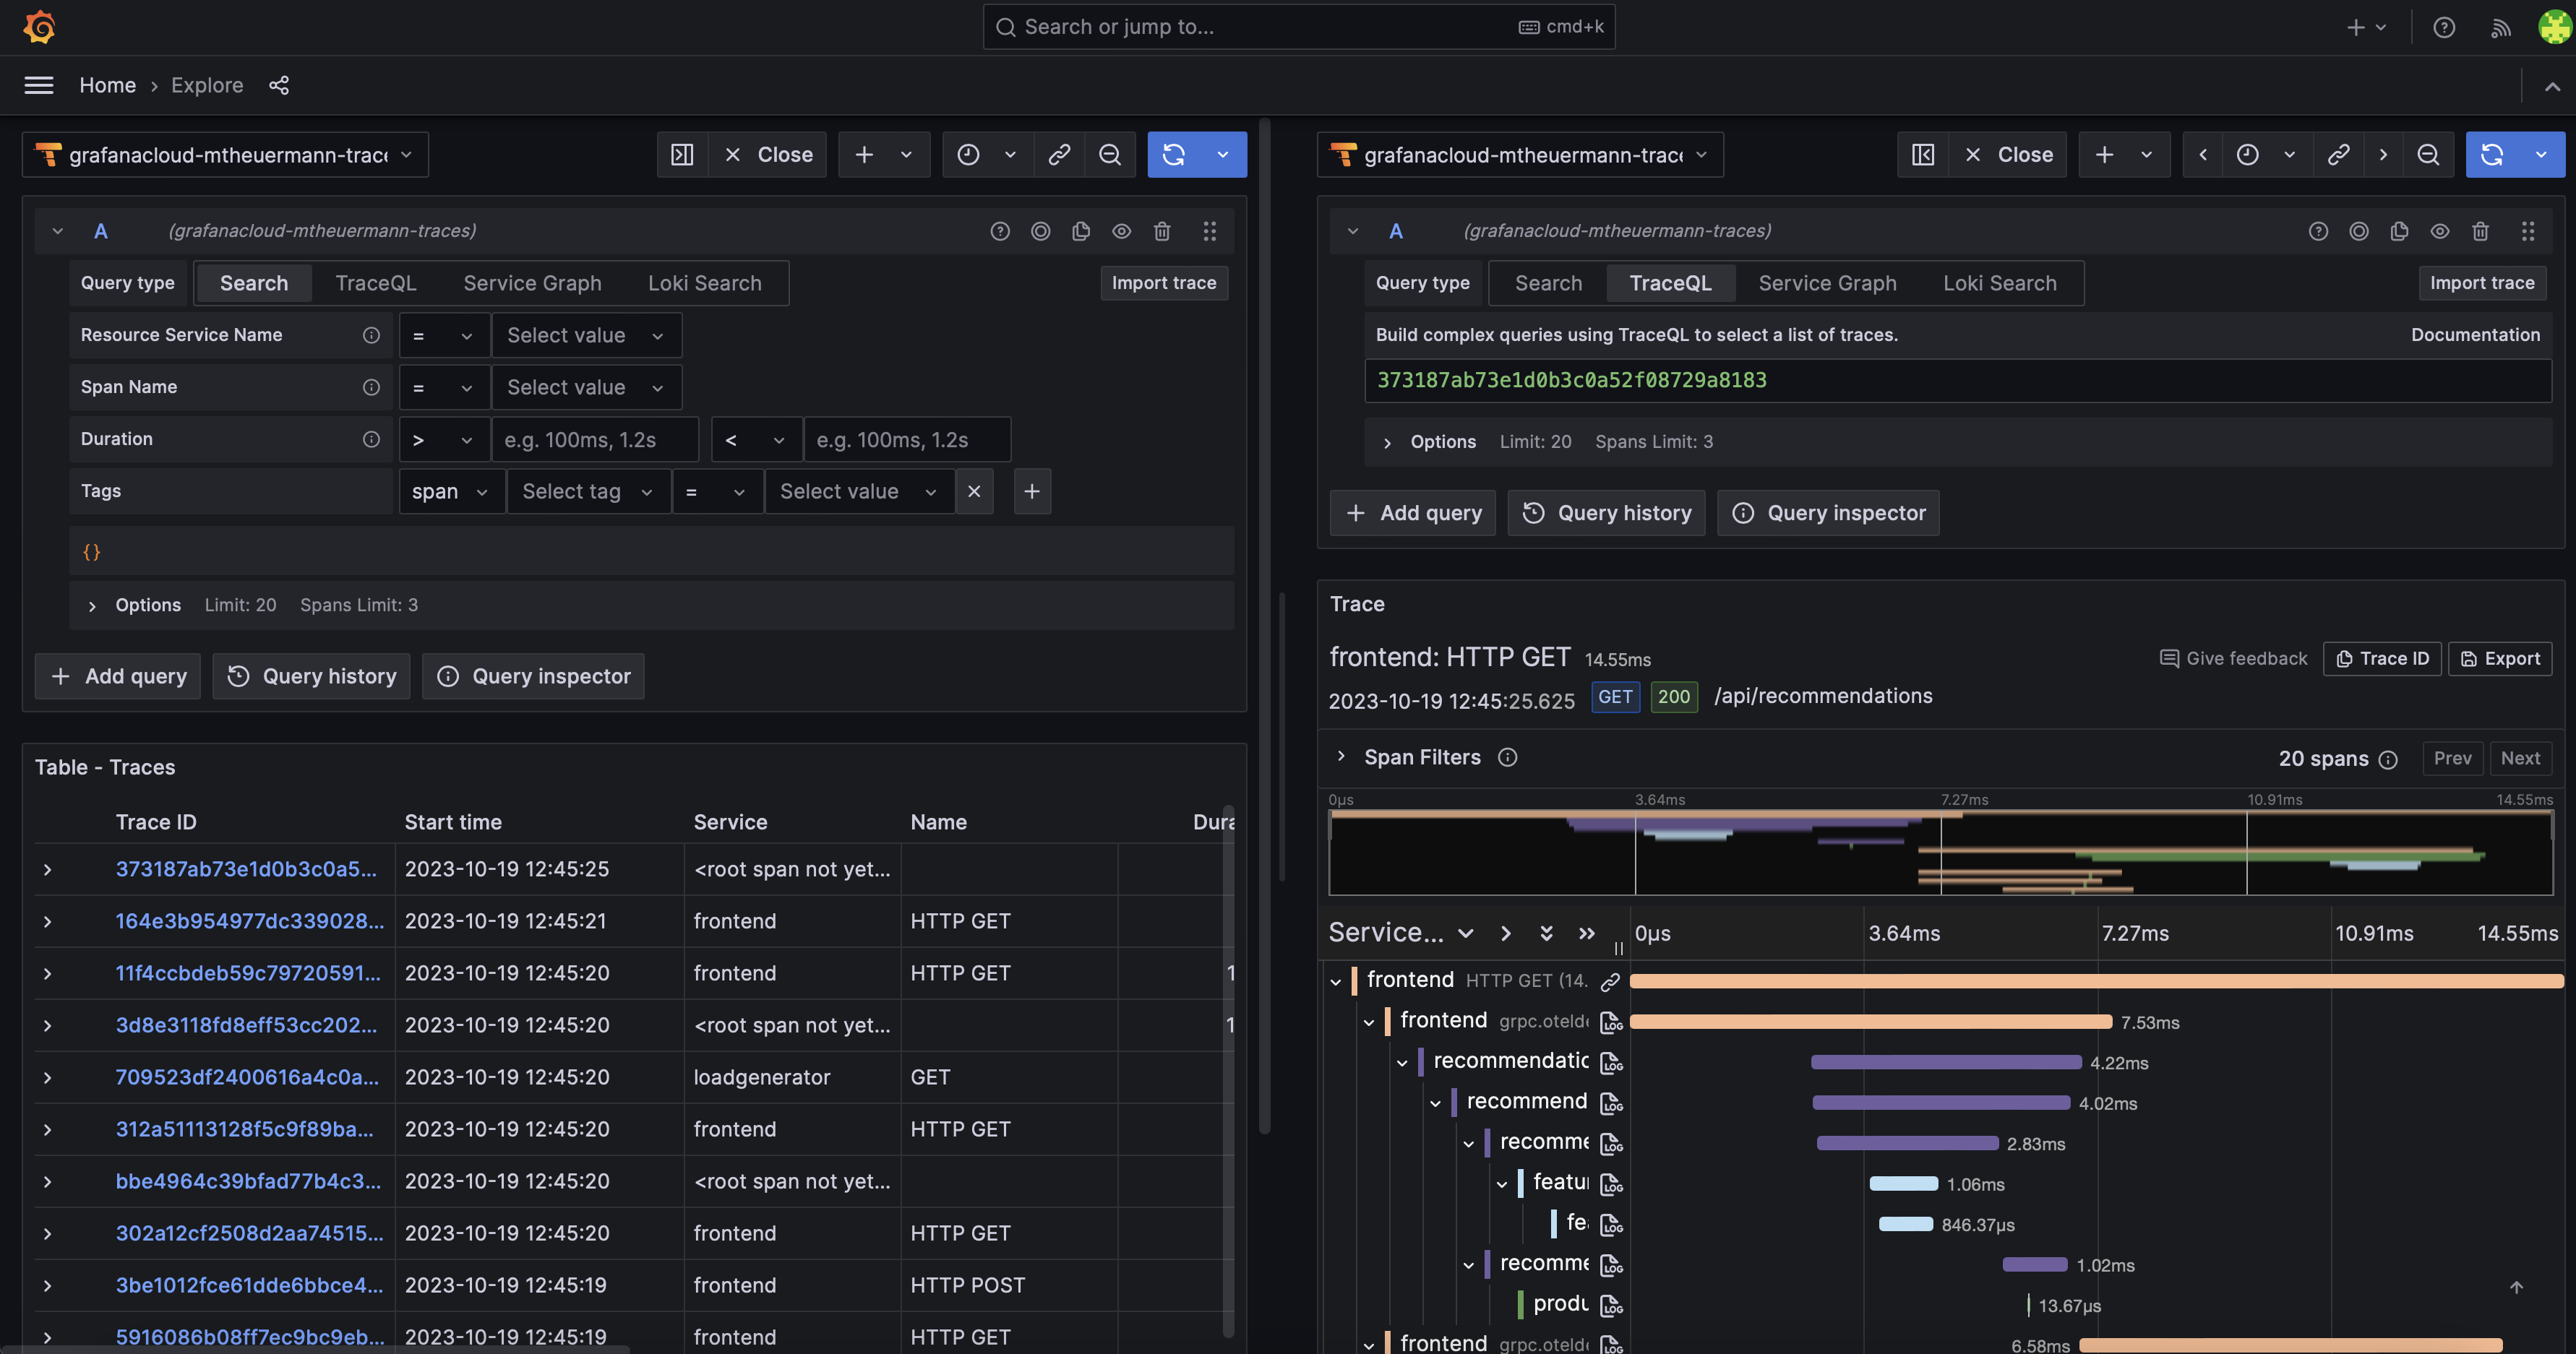
On the Explorer tap switch to the Tempo data source and explore the traces:
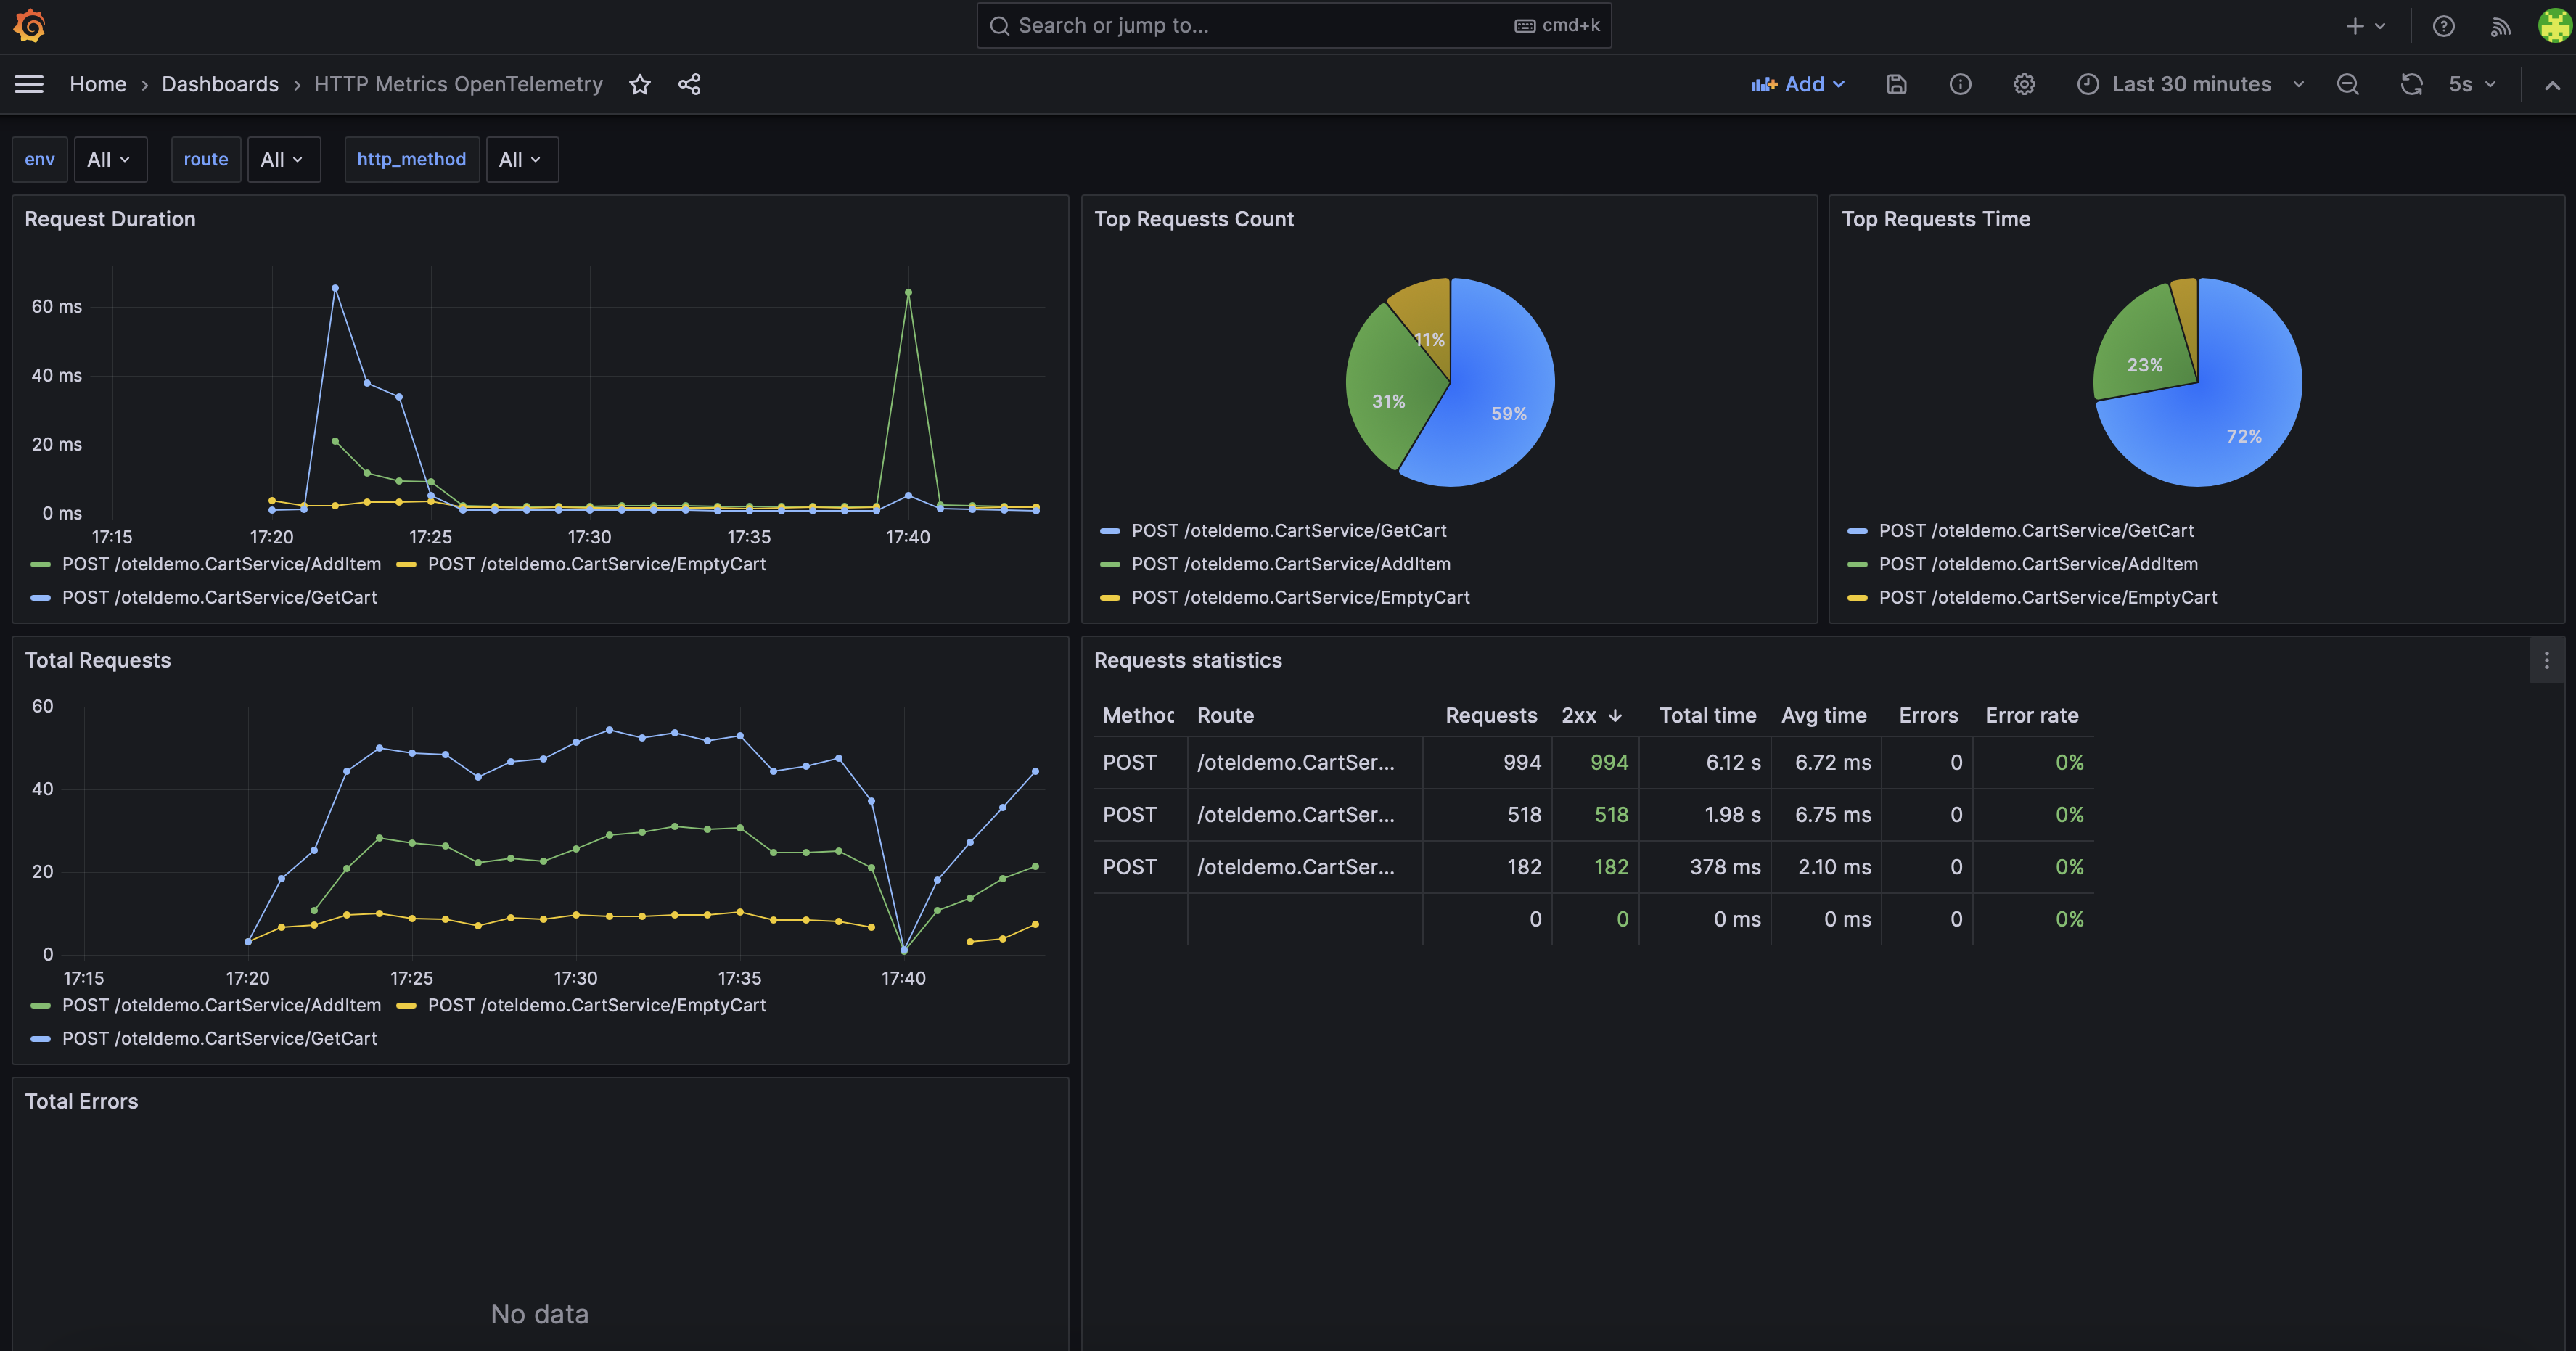
On the right upper corner of Grafana Cloud we can use the “+“ sign to add new dashboards. We can import predefined dashboards like the “HTTP Metrics OpenTelemetry“ dashboard, using the ID: 18860
In this blog post, we covered the following topics:
Analyse the current state of your services.
Dive into the world of DevOps, Source Control Management, CI/CD and Containers.
This is an introduction to Kubernetes, an open-source system for automating deployment, scaling, and management of containerized applications.
If you already run Nomad + Vault patterns in production, the first question about OpenBao is simple: will our existing workloads still run without a rewrite? In
When we published our HashiCorp Nomad and Vault: Dynamic Secrets post, the demo ran exclusively as a Python Flask application. Since then, the repository has
The previous article, Tool-Surface Compression, was about getting external functionality, entire APIs and systems, into the agent as token-efficiently as
2,500 API endpoints. Expose every one of them as an MCP tool and you get, according to Cloudflare, 1.17 million tokens for tool definitions alone, before the
Every Nomad tutorial you will find online uses the docker driver. That makes sense — containers are portable, images bundle everything, and Docker is
You are interested in our courses or you simply have a question that needs answering? You can contact us at anytime! We will do our best to answer all your questions.
Contact us