
NetBird vs Tailscale vs Headscale (2026): A Mesh VPN Comparison for Private Cloud Access
Over the last two weeks we introduced three mesh VPN solutions one at a time: NetBird, Tailscale, and Headscale. Three posts, three products, one open question:

In today's complex IT environments, system administrators and DevOps teams are constantly challenged to manage and troubleshoot distributed systems efficiently. Ansible, a powerful automation tool, simplifies many aspects of configuration management and orchestration. However, as the scale and complexity of infrastructures increase, it becomes essential to gain deeper insights into Ansible operations for performance optimization and debugging.
This is where OpenTelemetry and Jaeger come into play. In this blog post, we'll explore why sending traces from Ansible over OpenTelemetry to Jaeger can significantly benefit your automation processes as well as showcase an example implementation.
Before delving into the benefits, let's clarify some fundamental concepts:
Now, let's explore why combining Ansible with OpenTelemetry and Jaeger makes sense.
To illustrate the real-world benefits of sending traces from Ansible over OpenTelemetry to Jaeger, let's dive into a practical example. In this scenario, we'll consider a simple use case where we want to ping our local workstation.
Before we get started, let's outline the requirements for our practical example:
After all the dependencies are installed, let’s set everything up! First we will create a k3d cluster by executing the following command in a CLI of your choice:
1k3d cluster create otel-ansible --api-port 6550 -p "80:80@loadbalancer" --agents 2
Now we need to install the Jaeger instance as well as the OTel-Collector. Therefore first create a simplest.yaml file with the following content, before executing the commands below:
1apiVersion: jaegertracing.io/v1
2kind: Jaeger
3metadata:
4  name: simplest
Following the creation of the file above you may execute the commands below:
 1helm repo add jetstack https://charts.jetstack.io
 2
 3helm upgrade --install \
 4  cert-manager jetstack/cert-manager \
 5  --namespace cert-manager \
 6  --create-namespace \
 7  --version v1.7.1 \
 8  --set installCRDs=true \
 9  --wait
10
11kubectl create namespace observability
12
13kubectl create -f https://github.com/jaegertracing/jaeger-operator/releases/download/v1.38.0/jaeger-operator.yaml -n observability
14
15kubectl apply -f simplest.yaml
Now our cluster should look like this (you can simply type k9s to view your cluster):
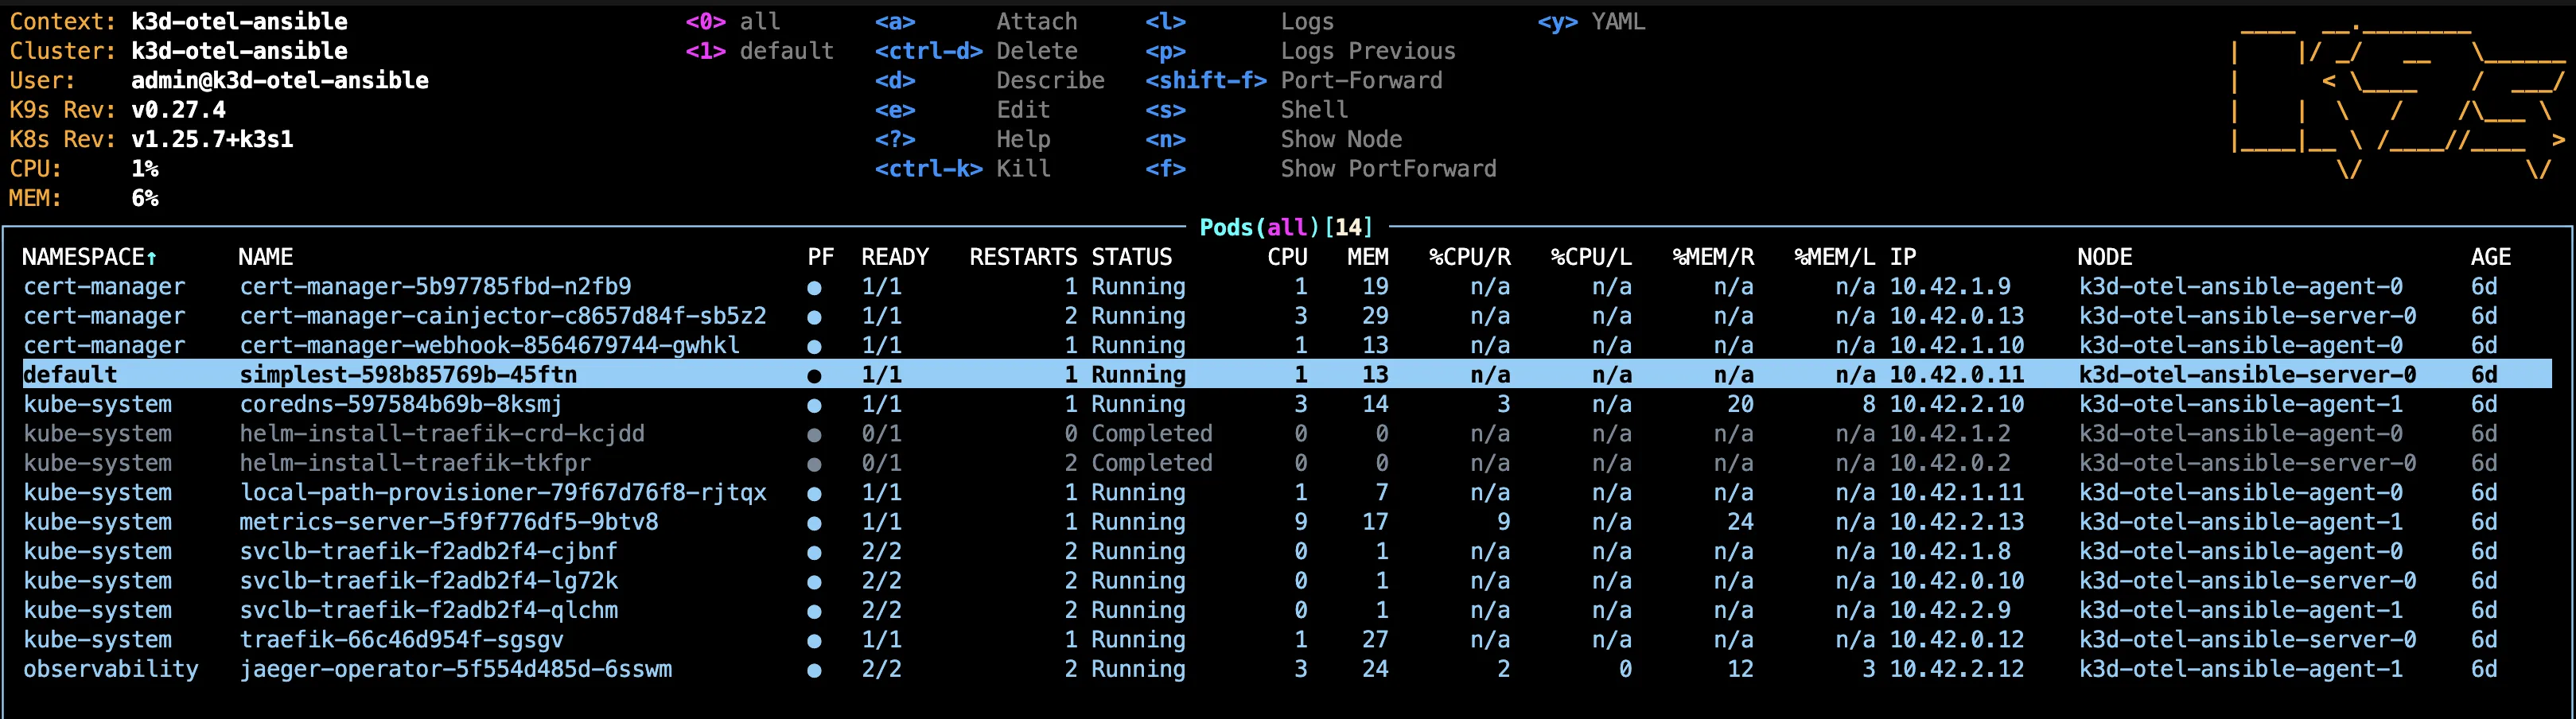
We will need the IP address of the marked pod in our next step so please note it down!
All that is left, before we turn to Ansible, is to install the OTel-Collector. We will need to customize our collector to receive traces and send them to Jaeger. Therefore create a values.yaml file where we will define these changes (don’t forget to change the address):
 1mode: deployment
 2config:
 3  receivers:
 4    otlp:
 5      protocols:
 6        grpc:
 7          endpoint: 127.0.0.1:4317
 8
 9  exporters:
10    otlphttp:
11      endpoint: http://<YOUR JAEGER ADDRESS>:4318
12    logging:
13      loglevel: debug
14      sampling_initial: 5
15      sampling_thereafter: 200
16
17  service:
18    pipelines:
19      traces:
20        receivers: [otlp]
21        processors: []
22        exporters: [otlphttp, logging]
23      logs:
24        receivers: [otlp]
25        processors: []
26        exporters: [otlphttp, logging]
Now we can install the collector using Helm:
1helm repo add open-telemetry https://open-telemetry.github.io/opentelemetry-helm-charts
2
3helm install my-opentelemetry-collector open-telemetry/opentelemetry-collector --values=values.yaml
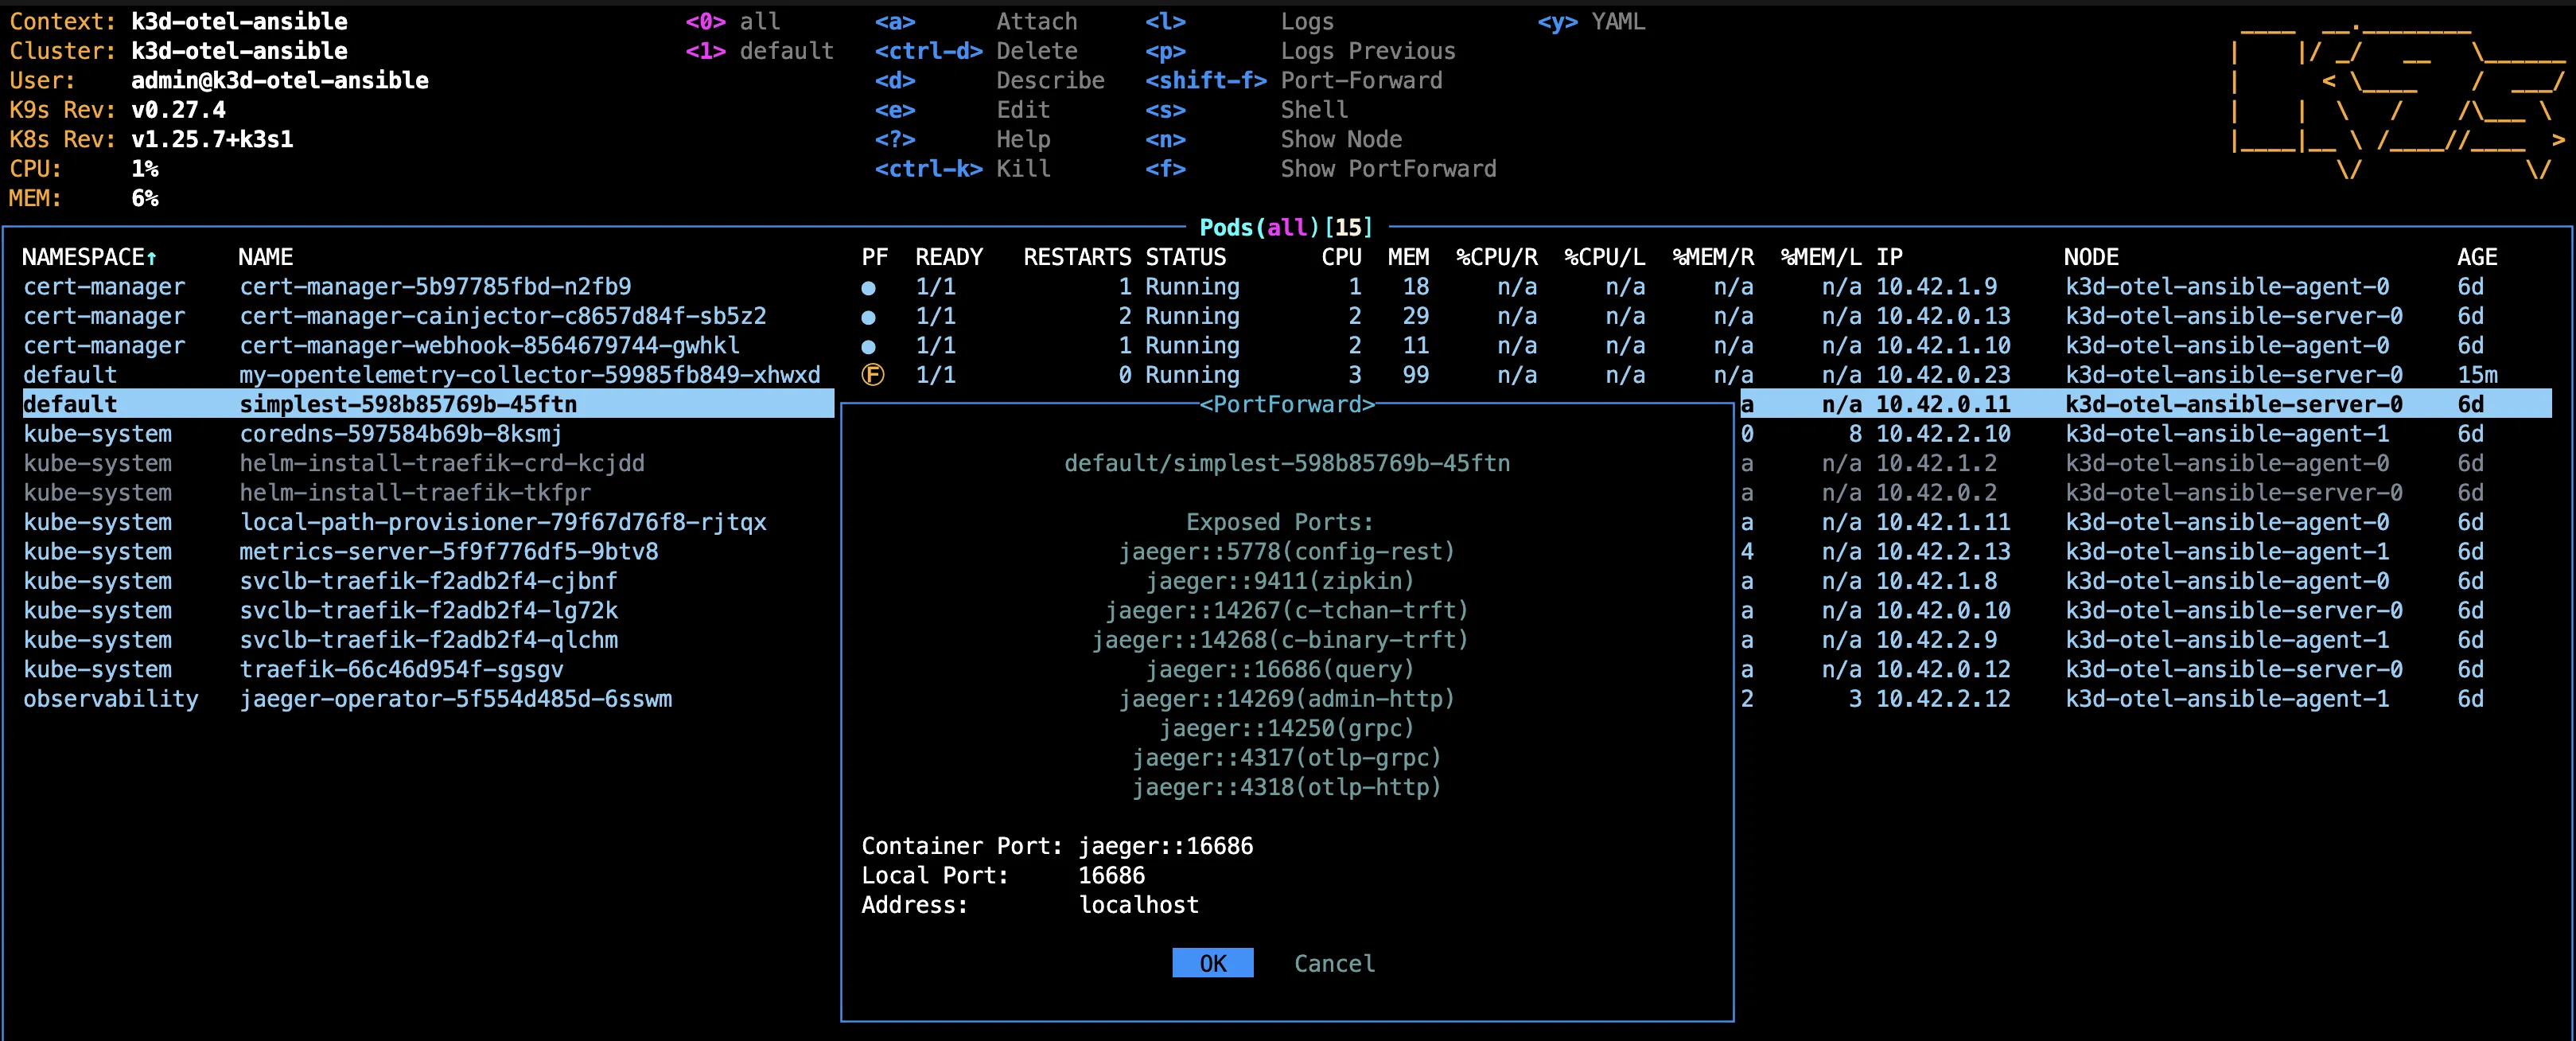
Finally we will want to expose the ports 16686 for our Jaeger instance and the port 4317 for the collector, which is made easy by using k9s interface, otherwise, you may use the commands:
1kubectl port-forward <JAEGER POD NAME> 16686:16686 &
2
3kubectl port-forward <COLLECTOR POD NAME> 4317:4317 &
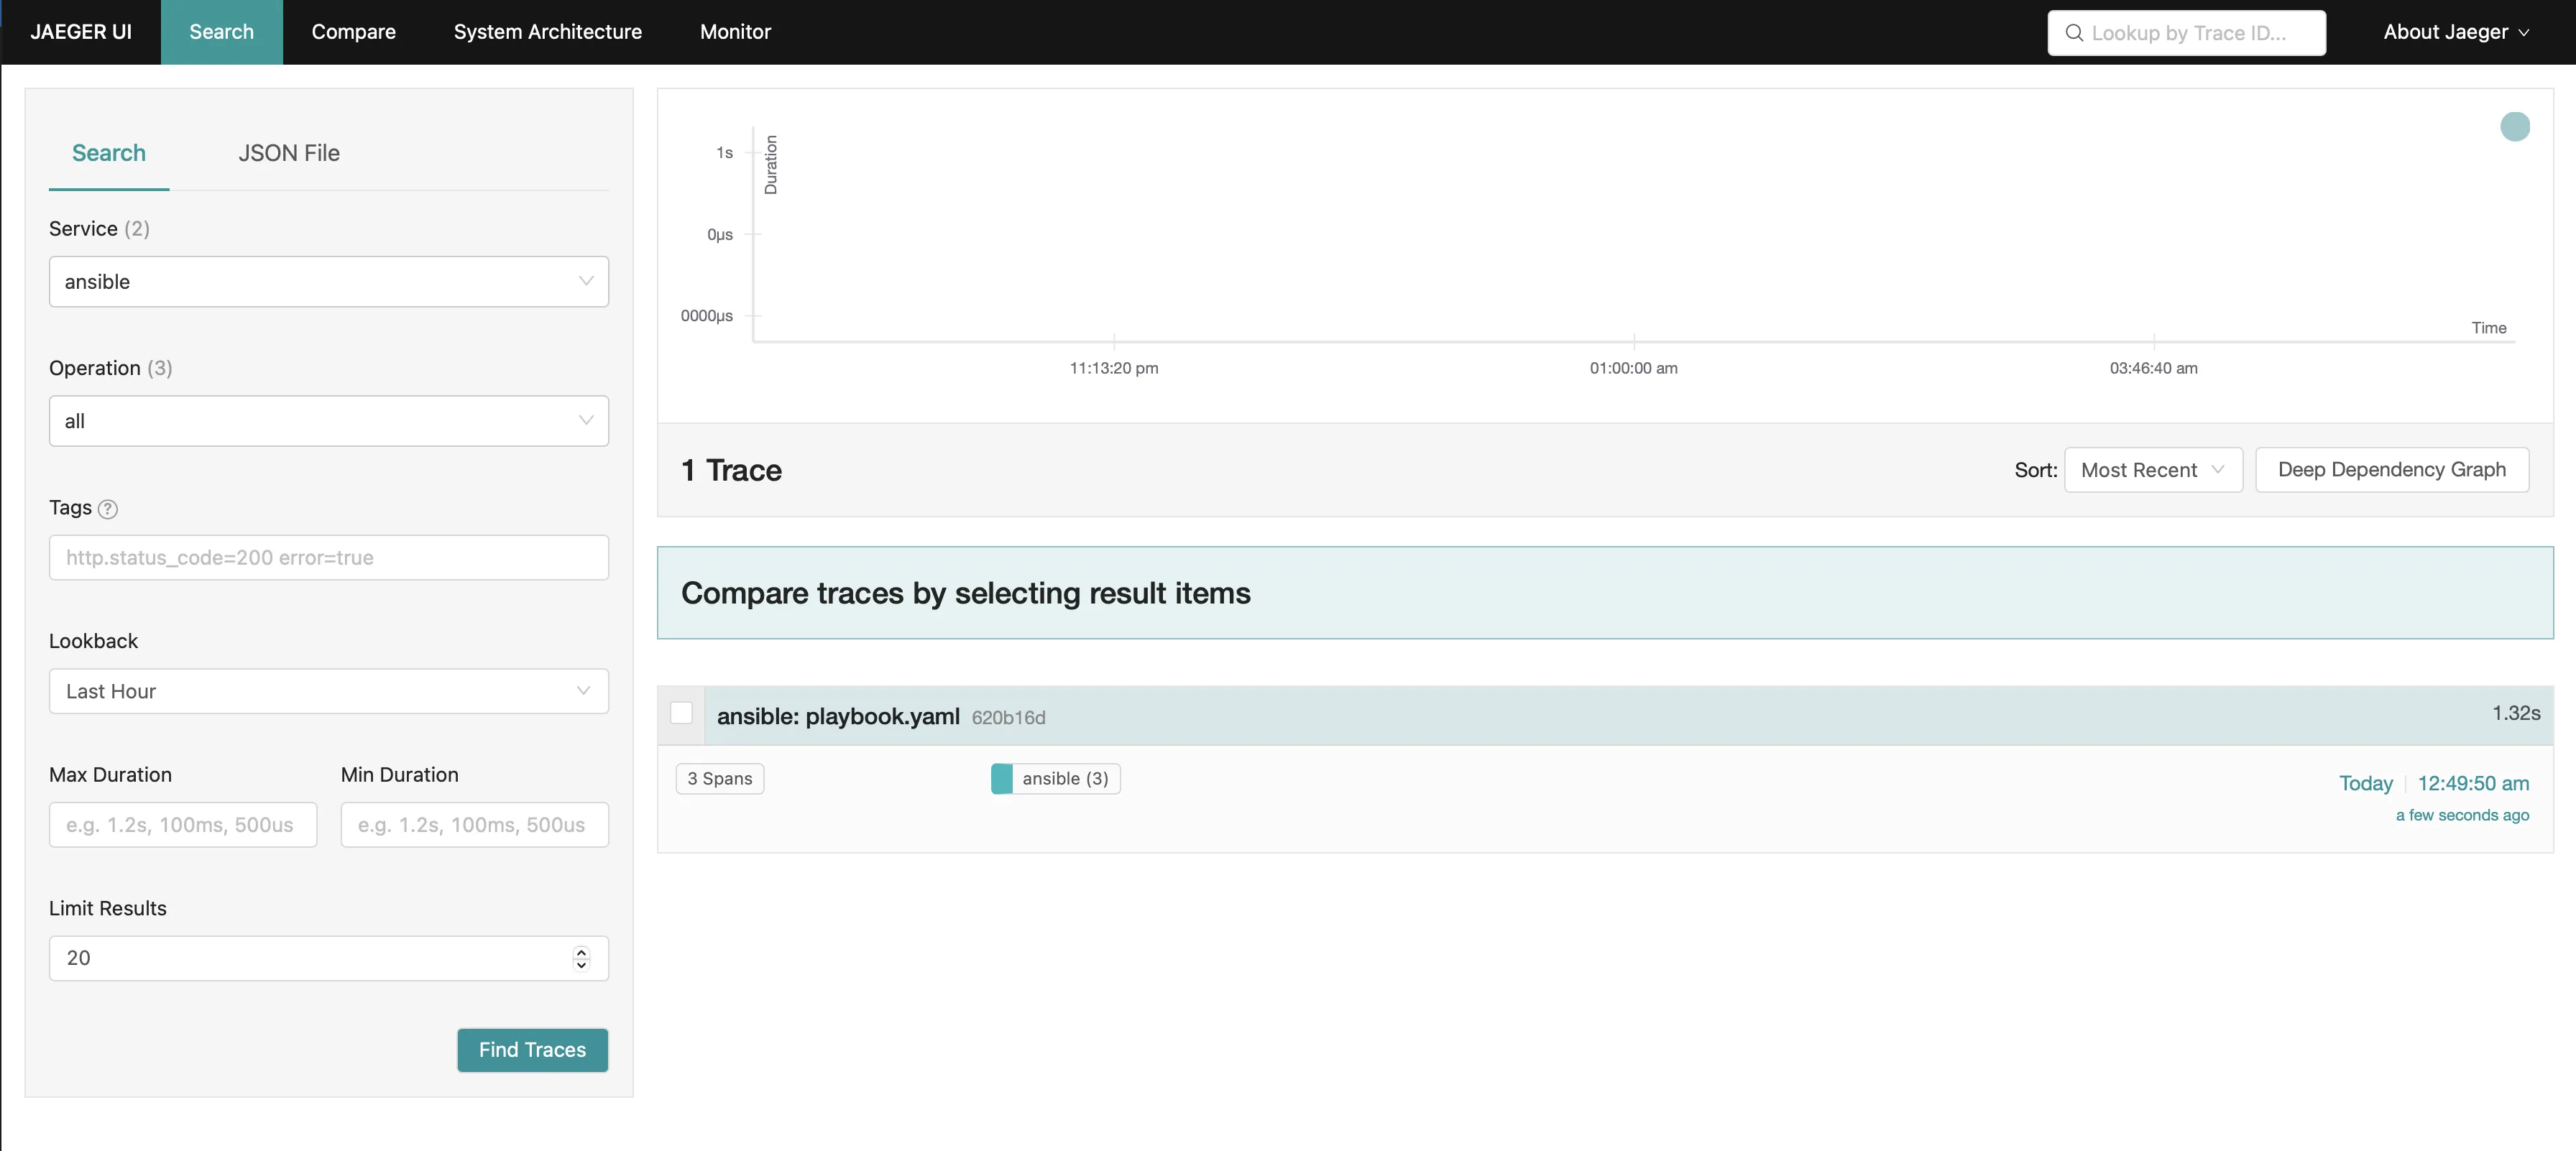
If you want you can take your first look at the Jaeger dashboard we just exposed at: http://localhost:16686
With this we can finally focus on Ansible.
The easiest way to get Ansible to send our data to the OTel-Collector is by using a community plugin for Ansible. Follow the instructions on this website to install the plugin.
The plugin requires, that we also install some pip packages. Therefore we will have to create a virtual environment with python, where we can install them. Simply follow the instructions at this website to create the virtual environment and activate it.
After activating the environment, we can install the pip packages:
1pip install opentelemetry-api
2
3pip install opentelemetry-sdk
4
5pip install opentelemetry-exporter-otlp
Once this is done we need a Python script (ansible-runner.py) that executes our playbook, which we will write later on:
1import ansible_runner
2
3# Path to your Ansible playbook
4playbook_path = "playbook.yaml"
5
6# Create an instance of AnsibleRunner and run it
7ansible_runner.run(private_data_dir='.', playbook=playbook_path)
Our playbook as can be seen in the script above, will be called playbook.yaml:
1---
2- name: Ping localhost
3  hosts: localhost
4  tasks:
5    - name: Send Ping
6      ansible.builtin.ping:
In addition to the playbook, we will have to define a config for Ansible (ansible.cfg):
1[defaults]
2inventory = inventory
3callbacks_enabled = community.general.opentelemetry
as well as our Inventory (inventory), which will contain a list of hosts:
1localhost ansible_connection=local
If we have created everything our folder structure should look similar to this:
1ansible-example
2├── artifacts # automatically generated
3└── YOUR PYTHON ENVIRONMENT FOLDER
4└── ansible-runner.py
5└── ansible.cfg
6└── inventory
7└── playbook.yaml
The only thing left to do, is to expose to environment variables, which will tell Ansible where to send the Traces to and how to refer to the service within Jaeger:
1export OTEL_EXPORTER_OTLP_ENDPOINT=http://localhost:4317
2
3export OTEL_SERVICE_NAME=ansible
And now let’s execute it:
1python ansible-runner.py
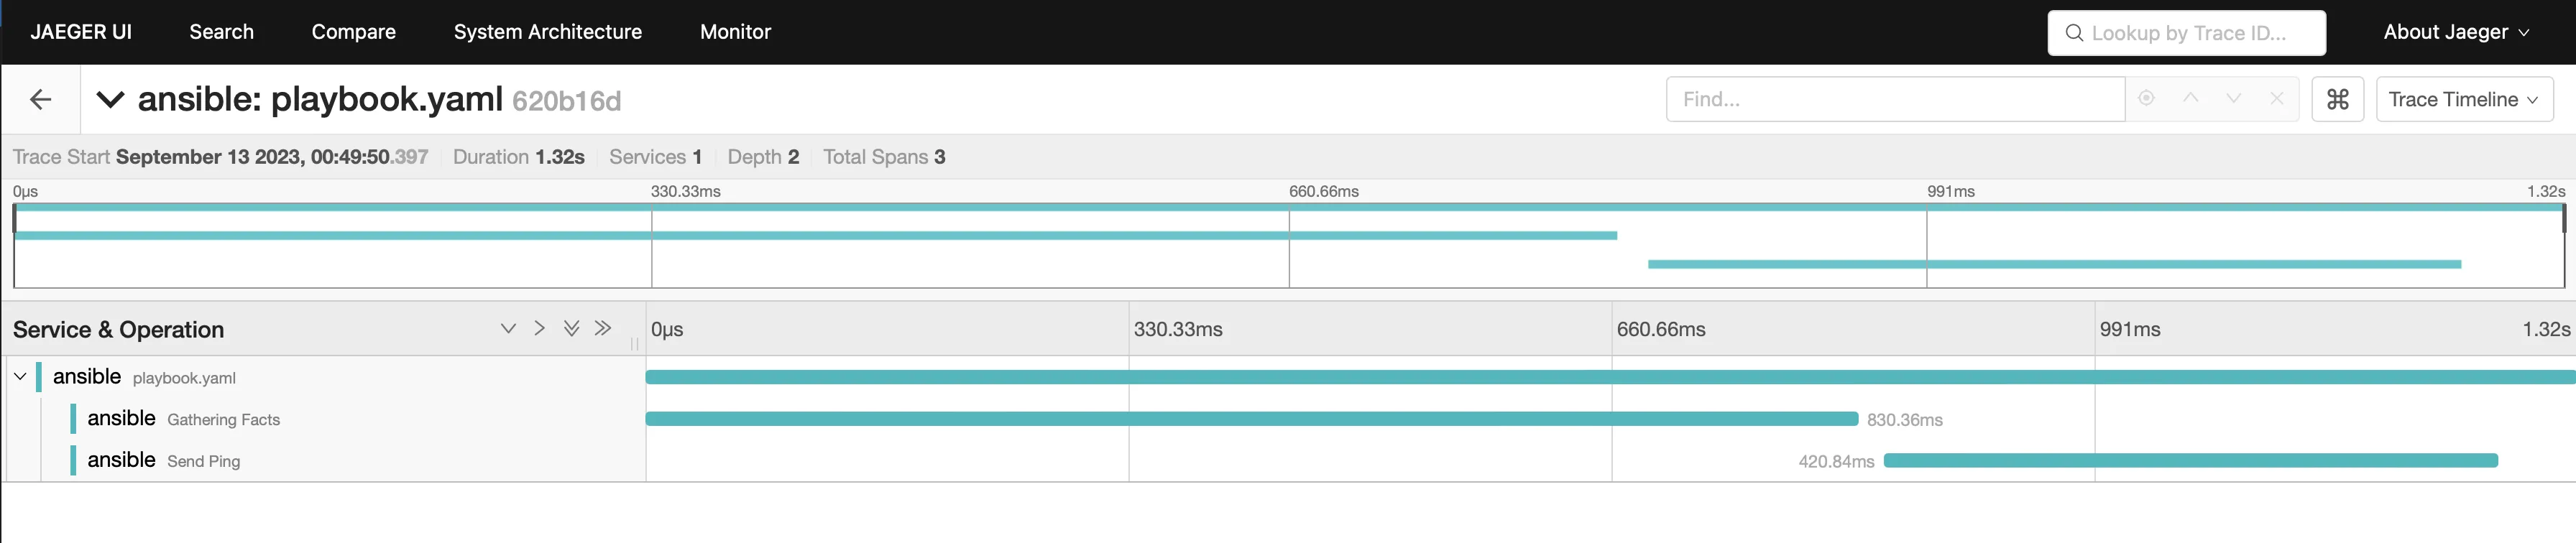
In today's dynamic and distributed IT landscapes, gaining observability into your automation processes is essential for maintaining performance, identifying issues, and ensuring the reliability of your infrastructure. Integrating Ansible with OpenTelemetry and Jaeger offers a powerful solution for achieving these goals. By leveraging OpenTelemetry's tracing capabilities, you can gain granular visibility into Ansible's operations, identify performance bottlenecks, and debug complex playbooks. Sending these traces to Jaeger further enhances your ability to monitor, troubleshoot, and optimize your automation processes, ultimately leading to more efficient and reliable infrastructure management.
Run your tests on autopilot with CI/CD pipelines.
Introduction to modern infrastructure provisioning.
This is an introduction to Kubernetes, an open-source system for automating deployment, scaling, and management of containerized applications.
Over the last two weeks we introduced three mesh VPN solutions one at a time: NetBird, Tailscale, and Headscale. Three posts, three products, one open question:
In Post 2 of this series we introduced Tailscale as the UX gold standard in the mesh VPN segment. With one honest caveat: The control plane is proprietary, runs
Mesh VPNs are replacing the old concentrator model. Anyone stepping into this space cannot avoid one name: Tailscale. The service has been the UX gold standard
Classic SSL VPNs are aging. The last two years have shown multiple critical vulnerabilities in the major concentrator products, while at the same time the
Earlier this year I had the chance to attend an IBM watsonx Orchestrate workshop. After the workshop I kept going – setting up Orchestrate's Agent Development
You are interested in our courses or you simply have a question that needs answering? You can contact us at anytime! We will do our best to answer all your questions.
Contact us